Monthly Archives: February 2017

Work backwards & cognitive dissonance

My current hero is Dan Marsh. Dan is a business analyst who has just finished his apprenticeship at my client. Dan had the courage to say that what I taught about Feature Injection’s working backwards (That tea bag stuff) actually scared him. Subsequently we had a great session to understand what he found so scary. As a result we came up with the following approach to explain “Work Backwards”. I will explain the subtle but important changes at the end.

We are skipping the “Hunt the value” or “OO” part of Jennie’s “OOPSI” model. And lets assume we have designed one or more “Output” that satisfies our “Outcome” (Design Brief – “We satisfy the “Need” of a “Group of Customers” and as a result the business received value which we measure using a “Metric”).

Consider the Design Brief (As a “Super Fan” I have a need to know “where my favourite celebrities went to school and played their first gigs so that I can go on a pilgrimage” and as a result the company will get more “Super fans”). So the product squad have collaborated on and tested and user tested designs to the point they have an experiment they want to scale out to more of the “Super fans”.

The design they come up with is “A mobile phone app to enable you to do a walking tour of a city to see all the locations where your favourite celebrity lived and played). Something like…
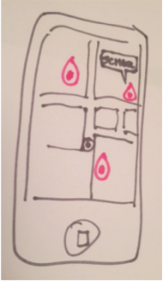
celebritywalkingtourapp

We create an initial Epic to build the experimental product. “Mobile App One to meet Design Brief”. Normally at this point we would break the Epic into stories. Instead we write the Acceptance Criteria using the Given-When-Then format. We start with the Value in creating our value stream. the thing that gives value to the customer, the THEN…

  • THEN the application displays a map
  • AND the current location is at the center of the map
  • AND the location of celebrity sites
  • AND the name of the important celebrity sites

So what are the things that could go wrong? Lets consider these as TODO’s that we will come back to in this Epic or more likely in other Epics.

  • TODO – The centre of the maps is a specified location (e.g. Zip/Post Code)
  • TODO – There are no celebrity sites (An arrow at the edge of the map indicating direction of closest site?)
  • TODO – There are no important celebrity sites

We now consider when the app displays the map. The normal response is to suggest when the app is opened. Alternatively it could be when the phone is near to one of the sites.

  • WHEN the phone is within the specified distance

And another TODO which will almost certainly go into another Epic.

  • TODO – When the app is opened.

We need to update the THEN as well to include an alert.

  • THEN the application displays a map
  • AND the current location is at the center of the map
  • AND the location of celebrity sites
  • AND the name of the important celebrity sites
  • AND the phone alerts the user

Now we can look at the necessary conditions for this to happen.

  • GIVEN user has selected a celebrity
  • AND there are celebrity sites nearby
  • AND user has marked celebrity site as important
  • AND user has enabled location services
  • AND user has enabled alerts
  • AND the user is logged in.

With an associated set of TODOs that go in additional Epics…

  • TODO user has not selected a celebrity
  • TODO there are no celebrity sites nearby
  • TODO user has not marked celebrity site as important
  • TODO user has not enabled location services
  • TODO user has not enabled alerts
  • TODO user is not logged in

Each GIVEN becomes a THEN in another scenario… For example

  • THEN the user has selected a celebrity
  • WHEN the user “snapz” the celebrity
  • GIVEN the user has selected a celebrity site
  • AND the user is logged in

… with associated TODOs, And the GIVEN in this scenario becomes a THEN in another scenario.

  • THEN the user has selected a celebrity site
  • WHEN the user “snapz” a celebrity site
  • GIVEN the user is viewing the map
  • AND a celebrity site is visible on the map
  • AND the user is logged in

… with associated TODOs (Only a couple mentioned)

  • TODO – User is looking at the list of celebrities.
  • TODO – User selects a band with more than one member.

And the GIVEN in this scenario becomes a THEN in another scenario.

  • THEN the user is logged in
  • WHEN the user presents their thumb print to the phone
  • GIVEN the user has entered the app
  • AND has registered using their thumb print

TODO – User name and password… because everyone does it that way. Just like putting the engine at the front of the car because people are used to seeing the horses before the cart, and like the idea of putting the “Cart before the horse”.

We can visualise the pattern of the scenarios evolving from the output to the inputs as follows:

screen-shot-2017-02-11-at-20-12-51

Which we can summarise as:

screen-shot-2017-02-11-at-20-13-22

And then we can reveal the pattern more clearly if we zoom out even further (and I’ve changed the TODO’s to clear boxes) as follows:

screen-shot-2017-02-11-at-21-21-44

This is the insight that Dan Marsh gave me. This is a natural way for people to work, from left to right. That means the output is on the left and the inputs are on the right which is contrary to the way I have represented this in the past. Also the natural way to write for THEN-WHEN-GIVEN is top to bottom whereas I have been teaching them to write GIVEN-WHEN-THEN from bottom to top which is also counter to the way people think. The right to left representation that confused people is below:
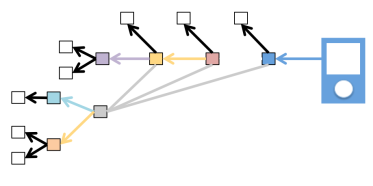
screen-shot-2017-02-11-at-21-23-18

Dan also helped me understand the follow representation that I had used was also confusing.

screen-shot-2017-02-11-at-21-29-45

So from now on, the process flow to write scenarios is left to right, top to bottom, with the arrows pointing left to right.

Thank you Dan for being honest about your thoughts. I think this is a huge insight. 🙂

From now on, I’m going to remove the cognitive dissonance. From now on, Its all about working forward from the output to the inputs.


The Zeroth Constraint.

The Theory of Constraints offers a simple five step process:

  1. Identify the constraint
  2. Prioritise work at the constraint
  3. Optimise the constraint
  4. Add capacity to the constraint
  5. Goto 1

Often the hardest thing to do is step 1, to identify the constraint.

One of the main frustrations for a coach is that they can see the constraint but cannot convince the organisation that they need to address the constraint. This is because the organisation has not reached the state of conscious competence about the constraint. They may see the constraint but they do not value it. Paul Adams talk reveals that famous people make us aware of new things but we only adopt them (value them) if one or more of the four people close to us in that context value it.

This means that often before the organisation will accept the constraint, they must first see the coach as a close trusted advisor. In order to achieve this, the coach must first help the organisation remove the constraints that the organisation think are the most important. Even though the coach might be torn because Theory of Constraints shows that working on anything other than the constraint has no impact, they are actually working on the Zeroth Constraint. The Zeroth constraint is that the organisation do not see the coach as a close trusted advisor.

Coaches who do not address the zeroth constraint may find themselves frustrated or in conflict with the organisation they are coaching. They find themselves in this state because they are acting with integrity, they are trying to focus on the most valuable work for the organisation. However first, they need to align themselves and the organisation in terms of understand the value of fixing the true constraint. To do this, the coach may need to demonstrate that they can fix the constraints that bother the organisation even if they are not true constraints. Demonstrating this ability to address these constraints will give the organisation more confidence that the coach can help them fix constraints they might otherwise prefer not to acknowledge.

If you are coach who is worried about working on improving the system away from the constraint, feel confident that you are acting with integrity because you are working on the zeroth constraint.

This insight came out during a conversation with Tony Grout (of course). I would say it was his idea, he might say it was mine.


Trying to use Maths to prove Theory of Constraints.

UPDATE – The proof is flawed. I have found an example that breaks the model. See update section at the bottom of the post.

I love applying Real Option thinking to things to see what pops out. This is an example of how Real Options makes proving Theory of Constraints really simple.

A few weeks ago Marc Burgauer (@Somesheep) introduced us to Klaus Leopold’s excellent boat game to demonstrate the benefits of limiting WIP and its impact on lead time. The game is elegantly simple, a line of people take turns making origami folds to turn a sheet of paper into a paper boat. Each person does the same one or two folds each time. The last person records when each boat arrives since the start of the exercise.We had a bit of a challenge to get the point. i.e. The rate of completing things remains the same, but the lead time becomes stable and predictable. After some discussions, Marc, Nick Poulton and I decide to modify the experience to hit people over the head with the results. We modified the game to record the time at which each boat was started as well as the time at which each boat was finished. Then we plotted a Cumulative Flow Diagram of the start and finish times…

screen-shot-2017-02-05-at-13-15-56

When you push work into the system, you build up work in progress (inventory) and the lead time increases.

Next you introduce single piece flow and plot the start and finish times…

screen-shot-2017-02-05-at-13-24-42

This results in a fixed amount of work in progress (inventory) and a fixed lead time.

IT DOES NOT INCREASE THE RATE AT WHICH VALUE IS DELIVERED! THAT IS FIXED.

Any additional work (investment) entered into the system above the finish rate is waste. It simply builds inventory. The area in the triangle formed by the two start lines (red and blue) below is pure waste. It is investment that is trapped in the system that is not generating a return.

screen-shot-2017-02-05-at-13-36-30

I plotted the graph to complete each item of work as it moved through the process. To do this I considered that there are two ways to express the rate at which a process can be expressed.

  1. The number of widgets in a fixed time.
  2. The amount of time a widget takes to process.

We tend to use the number of widgets in a fixed time. It is easier to discard the time elements and easier to compare one rate to another. In software development, we refer to velocity which is the number of widgets in a fixed time. Plotting the graph of each work item is easier when you use the amount of time a widget takes to process.

One thing that jumps out at you is that the rate for finishing a widget is the same as the rate of the slowest process step. This is not intuitive, especially when the process is a network rather than a linear set of steps. But why was I surprised? This is surely just the Theory of Constraints.

And then I realised. Theory of Constraints was a belief for me. It contained uncertainty. I did not know for certain that it always worked, in all situations. I had doubt and because I had doubt, I did not always apply it.

So I created a reasonably complicated network process:

screen-shot-2017-02-05-at-14-31-16

<Warning – Possible bad maths ahead. I’ve not checked this with an expert yet>

And I created a spreadsheet to see how long it would take things to complete. This is where Real Options thinking came in (or value stream mapping if you prefer) and we work backward from the end of the process to the start. For each process step, the time to the end of the process step Pn(k) is:

  1. The time to complete the process step T(Pn), plus
  2. The earliest time the process step can start.

Pn(k) = T(Pn) + ET(Pn(k))

The earliest time the process step can start is the latest of:

  1. The time the previous Pn piece of work finished ( Pn(k-1) )
  2. The latest time the preceding x process steps finished

Therefore the earliest time the process step can start is:

ET(Pn(k)) = MAX ( Pn(k-1), Pn-1(k) … Pn-x(k) )

The rate for Pn (expressed in seconds per widget) is

Rate(Pn) = MAX ( T(Pn), Rate(Pn-1) …. Rate(Pn-x) )

This leads through recursively to

The rate for Pn (expressed in seconds per widget) is

Rate(Pn) = MAX ( T(Pn), MAX(T(Pn-1), Rate(Pn-y), ….), MAX(T(Pn-x), Rate(Pn-z) )

As the MAX function is associative, We can write

Rate(Pn) = MAX ( T(Pn), T(Pn-1), T(Pn-x), T(Pn-y), T(Pn-z) )

i.e. The rate for any process step is the max rate (expressed in seconds per widget) of itself or any preceding process step in the graph.

<Math note – I’m not up to snuff on how you annotate graphs. Hence its a bit of a mess.>

Conclusion – Theory of constraints is not a theory. It should be easy to prove mathematically by someone with better math and more rigour than me.

It also means that pushing more work into a system beyond the rate of the constraint is quite simply a waste of money. IT Executives should be judged on the rate at which money is invested into the IT department and the rate at which that investment delivers value. In effect, a CFD based on money in and money out which is just another way of representing lead time.

If you want a copy of the spreadsheet, leave a comment here, or ping me on twitter.

UPDATE – The following example has a rate faster than the constraint.This is due to inventory building up behind the constraint before work items through the other path reach the convergence process point (P4).

It looks like it still holds over the long run in the steady state. Need to think more about the start up phase and the implications of that.

More details to follow.

screen-shot-2017-02-05-at-20-30-23